I created a number of pie charts which compared the data for a number of clients in different years. As some of the clients did not have any data in some of the years the default colours were mixed up.
To remedy this you can use the code below to specify the colours you want.
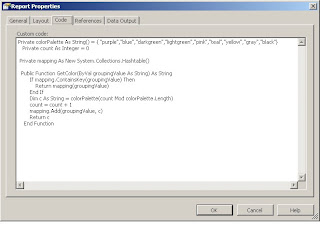
The code below is inserted in the report properties window under the code tab.
Private colorPalette As String() = { "purple","blue","darkgreen","lightgreen","pink","teal","yellow","gray","black"}
Private count As Integer = 0
Private mapping As New System.Collections.Hashtable()
Public Function GetColor(ByVal groupingValue As String) As String
If mapping.ContainsKey(groupingValue) Then
Return mapping(groupingValue)
End If
Dim c As String = colorPalette(count Mod colorPalette.Length)
count = count + 1
mapping.Add(groupingValue, c)
Return c
End Function
You can choose the colours you want in between the brackets the order is from let to right.
{ "purple","blue","darkgreen","lightgreen","pink","teal","yellow","gray","black"}
When you have entered the code you can use this in your pie chart.
Edit the value in the data tab of your chart properties then edit the value, appearance,series style, fill, color and then click on the expression box and enter the following expression
=Code.GetColor(Fields!.YOURFIELD.Value)
No comments:
Post a Comment